I blog about research design and statistics, often using examples from research on language learning.
Latest blog posts

Testing strong and weak null hypotheses in randomised experiments
assumptions
experiments
design features
nonparametric tests
R
significance

When interaction effects are hard to explain, try nested effects
contrast coding
multiple regression
R
tutorial
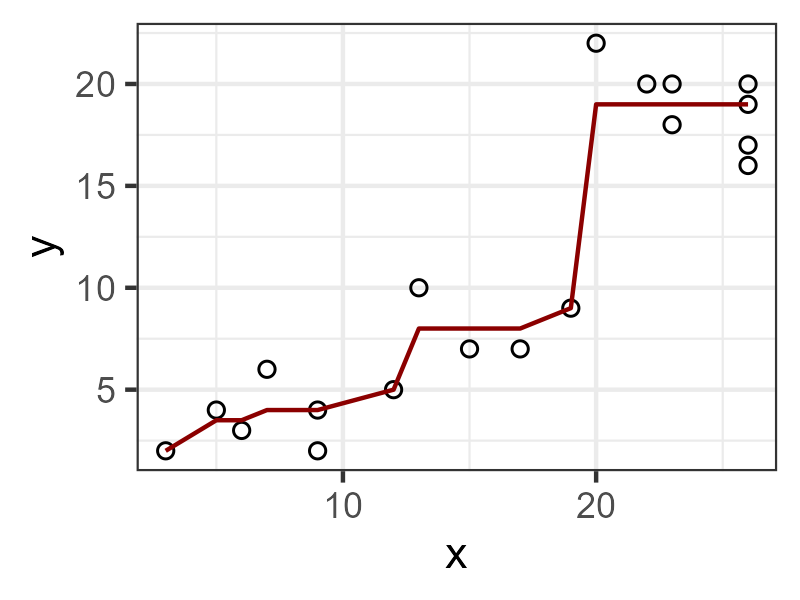
A quick introduction to isotonic regression
graphs
non-linearities
R

Does multilingualism really protect against accelerated ageing? Some critical comments
correlational studies
R

The population model and the randomisation model of statistical inference
assumptions
experiments
design features
nonparametric tests
R
significance

Clarifying research questions by sketching possible outcomes
research questions
research design

Exact significance tests for 2 × 2 tables
R
significance
Adjusting to Julia: Piecewise regression
Julia
piecewise regression
non-linearities
In research, don’t do things you don’t see the point of
simplicity
silly tests
research questions
The consequences of controlling for a post-treatment variable
R
multiple regression
Capitalising on covariates in cluster-randomised experiments
R
power
significance
design features
cluster-randomised experiments
preprint
Tutorial: Visualising statistical uncertainty using model-based graphs
R
graphs
logistic regression
mixed-effects models
multiple regression
Bayesian statistics
brms
Interpreting regression models: a reading list
measurement error
logistic regression
correlational studies
mixed-effects models
multiple regression
predictive modelling
research questions
contrast coding
reliability

Nonparametric tests aren’t a silver bullet when parametric assumptions are violated
R
power
significance
simplicity
assumptions
nonparametric tests

Tutorial: Obtaining directly interpretable regression coefficients by recoding categorical predictors
R
contrast coding
mixed-effects models
multiple regression
tutorial
research questions

Baby steps in Bayes: Incorporating reliability estimates in regression models
R
Stan
Bayesian statistics
measurement error
correlational studies
reliability

Baby steps in Bayes: Accounting for measurement error on a control variable
R
Stan
Bayesian statistics
measurement error
correlational studies
Five suggestions for simplifying research reports
simplicity
silly tests
graphs
cluster-randomised experiments
open science

Adjusting for a covariate in cluster-randomised experiments
R
power
significance
simplicity
mixed-effects models
cluster-randomised experiments

Drawing scatterplot matrices
R
graphs
correlational studies
non-linearities
multiple regression

Collinearity isn’t a disease that needs curing
R
multiple regression
assumptions
collinearity

Interactions in logistic regression models
R
logistic regression
tutorial
bootstrapping
Bayesian statistics
brms

Before worrying about model assumptions, think about model relevance
simplicity
graphs
non-linearities
assumptions

Guarantees in the long run vs. interpreting the data at hand: Two analyses of clustered data
R
mixed-effects models
cluster-randomised experiments

Baby steps in Bayes: Recoding predictors and homing in on specific comparisons
Bayesian statistics
brms
R
graphs
mixed-effects models
contrast coding


Looking for comments on a paper on model assumptions
R
graphs
tutorial
preprint
assumptions
cannonball

Baby steps in Bayes: Piecewise regression with two breakpoints
R
piecewise regression
non-linearities
Bayesian statistics
Stan
A data entry form with failsafes
data entry

Baby steps in Bayes: Piecewise regression
R
Stan
piecewise regression
non-linearities
Bayesian statistics
A brief comment on research questions
research questions

Checking model assumptions without getting paranoid
assumptions
R
tutorial
graphs
Consider generalisability
design features
mixed-effects models
Suggestions for more informative replication studies
design features
mixed-effects models
Increasing power and precision using covariates
power
design features
generalised additive models
non-linearities

Confidence interval-based optional stopping
R
design features
significance


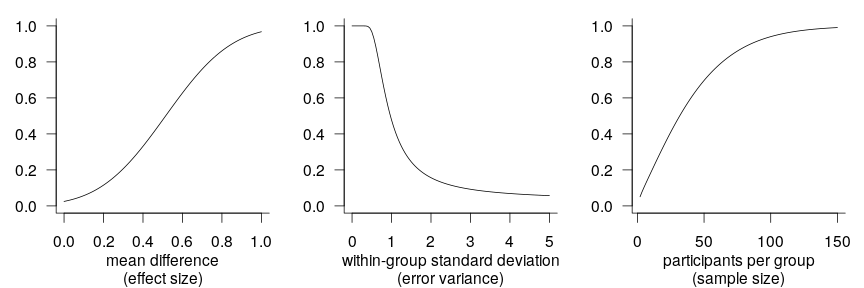
Abandoning standardised effect sizes and opening up other roads to power
power
effect sizes
measurement error
design features
R

Fitting interactions between continuous variables
R
graphs
generalised additive models
non-linearities

Tutorial: Adding confidence bands to effect displays
R
graphs
logistic regression
mixed-effects models
multiple regression
tutorial

Tutorial: Plotting regression models
R
graphs
logistic regression
mixed-effects models
multiple regression
tutorial

Confidence intervals for standardised mean differences
R
effect sizes
Which predictor is most important? Predictive utility vs. construct importance
effect sizes
correlational studies
measurement error

A few examples of bootstrapping
bootstrapping
R

What data patterns can lie behind a correlation coefficient?
effect sizes
graphs
correlational studies
non-linearities
R

The Centre for Open Science’s Preregistration Challenge: Why it’s relevant and some recommended background reading
significance
multiple comparisons
organisation
open science


R tip: Ordering factor levels more easily
R
graphics
Classifying second-language learners as native- or non-nativelike: Don’t neglect classification error rates
R
machine learning
random forests


Tutorial: Drawing a line chart
R
graphs
tutorial

Tutorial: Drawing a scatterplot
R
graphs
tutorial
Surviving the ANOVA onslaught
simplicity

Why reported R² values are often too high
effect sizes
multiple comparisons
multiple regression
R

On correcting for multiple comparisons: Five scenarios
significance
power
multiple comparisons
Silly significance tests: The main effects no one is interested in
simplicity
silly tests

Experiments with intact groups: spurious significance with improperly weighted t-tests
significance
design features
cluster-randomised experiments
R
Some advantages of sharing your data and code
open science

Drawing a scatterplot with a non-linear trend line
graphs
non-linearities
R


The problem with cutting up continuous variables and what to do when things aren’t linear
power
generalised additive models
non-linearities
R

Analysing experiments with intact groups: the problem and an easy solution
significance
power
design features
cluster-randomised experiments
R

Covariate adjustment in logistic mixed models: Is it worth the effort?
power
effect sizes
logistic regression
mixed-effects models
R
Controlling for confounding variables in correlational research: Four caveats
correlational studies
measurement error

Covariate adjustment in logistic regression — and some counterintuitive findings
power
effect sizes
logistic regression
R
Silly significance tests: Tests unrelated to the genuine research questions
silly tests
simplicity
power
multiple comparisons

Power simulations for comparing independent correlations
significance
power
R

More on why I don’t like standardised effect sizes
effect sizes
power
measurement error
A more selective approach to reporting statistics
effect sizes
graphs
simplicity

Explaining key concepts using permutation tests
significance
design features
R

Thinking about graphs
graphs
R

Why I don’t like standardised effect sizes
effect sizes
measurement error
Overaccuracy and false precision
simplicity

Some alternatives to bar plots
graphs
R

Assessing differences of significance
significance
R
Silly significance tests: Tautological tests
silly tests
simplicity

Silly significance tests: Balance tests
silly tests
simplicity
R

A purely graphical explanation of p-values
significance
R

Calibrating p-values in ‘flexible’ piecewise regression models
significance
piecewise regression
multiple comparisons
R
Analysing pretest/posttest data
significance
power
simplicity
R
No matching items