Courses
I offer one- and multi-day courses on quantitative methods and data analysis, geared principally towards Master’s and Ph.D. students, though they are equally suitable for postdocs or faculty.
Below are the courses for which material is readily available and that I can teach at fairly short notice. I would also be happy to develop courses on other topics on request.
If any of these courses interests you, or if you have a proposal for a different topic, feel free to get in touch by e-mail at janvanhove@gmail.com.
If you’re looking for individual consulting or departmental methods support rather than a structured course, check out the Methods and stats support page.
The reference rates are CHF 800 for a half-day course and CHF 1,200 for a full-day course. This does not include transport or, where applicable, lodging. If a course needs to be tailored substantially to the specific participant group or if it needs to be designed from scratch, this may be reflected in the quote. But even if this doesn’t quite fit your budget, get in touch anyway: depending on timing and location, we may be able to work something out.
The general linear model
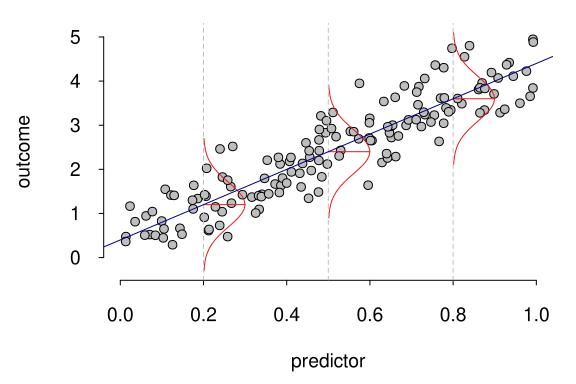
The general linear model is the workhorse of quantitative data analysis. Common procedures such as t-tests, ANOVA and linear regression can be understood as instances of this models, and other procedures such as logistic regression, mixed-effects models and generalised additive models are generalisations of it. Participants will learn how the general linear models works, how the parameter estimates it produces should be interpreted, and how the uncertainty about these estimates can be expressed.
- This course assumes familiarity with descriptive statistics (e.g., mean, median, variance, scatterplot).
- This is a three-day course that includes theory, worked examples, paper-and-pencil exercises and practical exercises in R. Ideally, it is scheduled over the course of a few weeks so that the participants can let the concepts sink in and try their hand at some exercises.
Design and analysis of experiments with intact groups
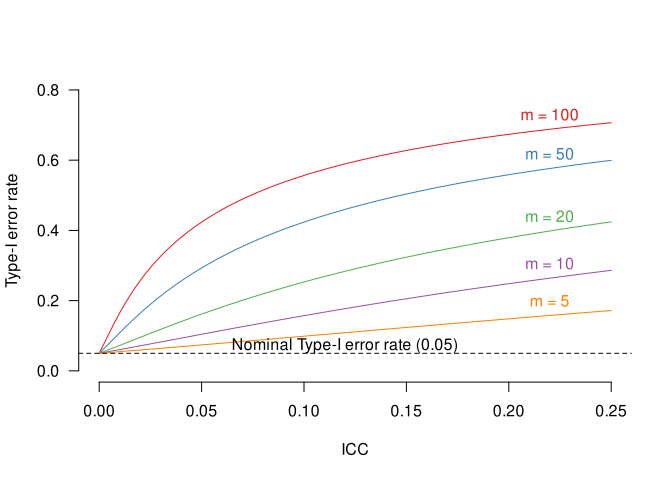
In lots of intervention studies in education and applied linguistics, intact classes or schools are assigned to the conditions in their entirety. It is imperative that the analysis should reflect the fact that the participants weren’t assigned to the conditions on an individual basis, otherwise it is embarrassingly easy for the study to yield overly optimistic findings. This course explains why this is so and how experiments with intact groups can be designed and analysed appropriately.
- Some experience with basic statistics (including hypothesis testing) is helpful but not strictly required.
- The course covers the principle of randomisation as a basis for statistical inference, exact and approximate hypothesis test, one-factorial, two-factorial and mixed designs for intact groups, the design effect and the intra-class correlation, simple and more complex analytical techniques, and the use of control variables.
- Available as a half-day course with theory, worked examples, and paper-and-pencil exercises.
Working with data sets in R
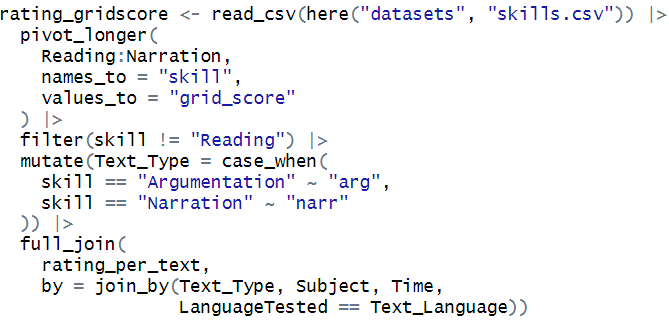
Often, the most time-consuming part of a data analysis is getting the data into a format in which they can be analysed in the first place. This course covers principles for organising data sets, techniques for transforming them so that are amenable to analysis, as well as ways to query and summarise them. The course relies principally on the tidyverse suite for R.
- No prerequisites.
- Available as a half-day course including theory, worked examples and pen-and-paper exercises.
- A session covering practical exercises in R can be organised at a separate date in order to give participants some time to process the contents and have a stab at doing some exercises at their own pace.
Visualising data in R
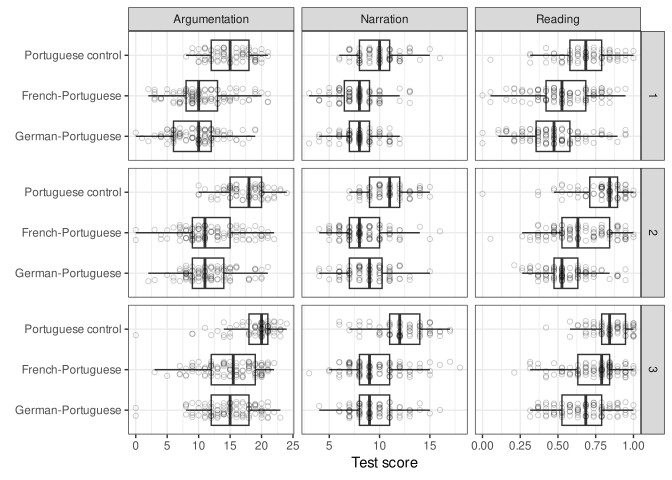
Both researchers and readers can glean more understanding from a well-chosen data visualisation than from a bunch of tables. This course teaches techniques for drawing informative data plots so that the participants and their readership may better understand what their data really look like. The main tool we’ll use is the ggplot2 package for R.
- While no prerequisites are required to appreciate the main ideas, participants will be better able to draw their own plots if they are also familiar with the contents of the course Working with data sets in R.
- The techniques covered include histograms, kernel density estimation, boxplots, dotplots, scatterplots, trend lines, and facetting.
- Available as a half-day course including theory, worked examples and pen-and-paper exercises.
- A session covering practical exercises in R can be organised at a separate date in order to give participants some time to process the contents and have a stab at doing some exercises at their own pace.
Visualising models and their uncertainty
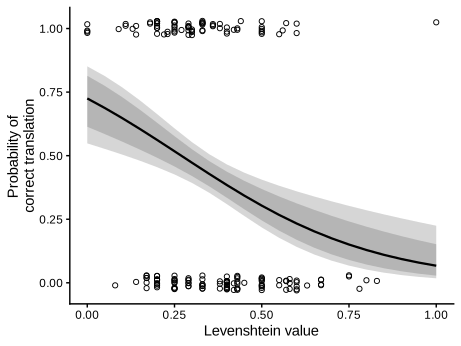
Statistical models are often quite opaque. Moreover, they yield estimates as opposed to exact answers. When models are reported solely in tables, erroneous interpretations are therefore bound to occur. This course teaches techniques for visualising statistical models and their uncertainty that will help make the participants’ models easier to interpret correctly.
- Participants should have some basic practical experience with regression modelling.
- The course covers point estimates, pointwise and simultaneous confidence intervals and confidence bands, prediction intervals, bootstrapping techniques, visualising simple and multiple linear regression models, visualising interactions and non-linearities, visualising logistic regression. On request, further techniques related to the kinds of model the participants use can be discussed as can techniques from the realm of interpretable machine learning.
- Available as a half-day course with theory, worked examples, and pen-and-paper exercises.