Summarise residual information in a diagnostic parade per cell or per unique predictor value
Source:R/parade_summary.R
parade_summary.RdThis function takes the output of the parade function
and summarises the residuals (and the fitted values) for each unique
combination of variables. This may be useful when checking the
constant-variance assumption but the nature of the data is such that
plotting the raw residuals will make them stand out from the distractor
plots even if non-constant variance isn't much of a problem.
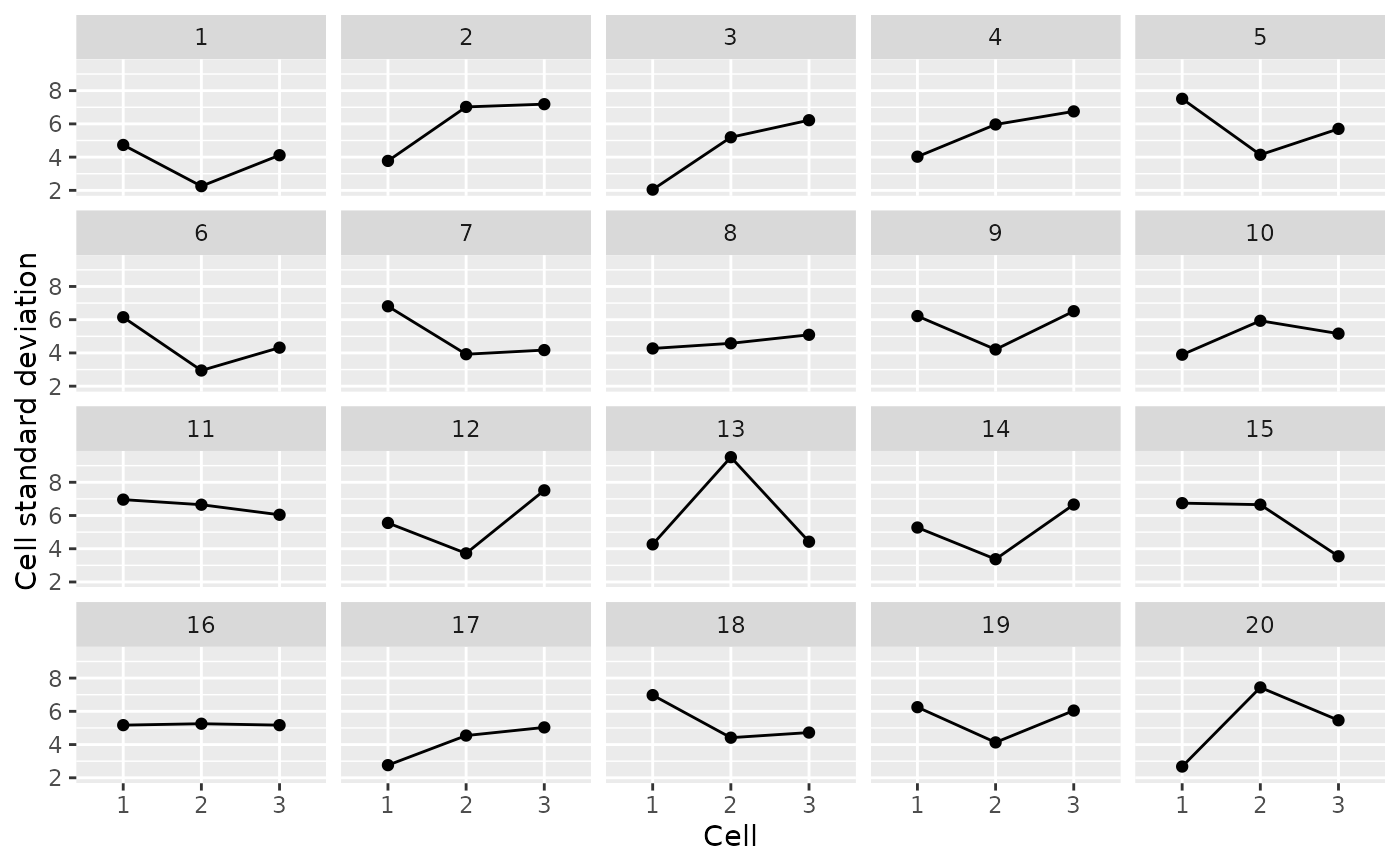
Feed the output of this function to var_plot to obtain a quick
diagnostic plot for the constant-variance assumption.
I think parade_summary is mostly useful when dealing with fairly
discrete outcome data, so the function will throw a warning if the
outcome data seem fairly continuous. (Arbitrarily when there are
more than 20 unique outcome values.)
It will also throw a warning when the non-outcome data used to define
the cells aren't categorical or when the number of observations per
cell seems low (arbitrarily fewer than 5 observations).
The assignment of cells in the design to cell numbers in the parade
summary is random. That is, one particular predictor combination
may be associated with Cell 3 when running parade_summary() one time,
but with Cell 1 when running it a second time. Within a given parade
summary, however, the same cell number always refers to the same
combination of predictor combinations.
Arguments
- parade
The name of an object generated using the
parade()function.- predictors_only
If you supplied a dataset to the
full_dataargument in theparade()call,parade_summary()will by default compute mean fitted values and a host of residual summaries for each unique combination of all the non-outcome variables in this dataset. To override this behaviour, setpredictors_onlytoFALSE; this causesparade_summary()to only compute mean fitted values and residual summaries for each unique combination of the predictors that are actually in the model.
Examples
# Fit model
m <- lm(mpg ~ gear, data = mtcars)
# Generate parade
my_parade <- parade(m)
# Summarise residuals by cell -
# you'll get some warnings. The second one
# because 'gear' is represented as a numeric variable.
my_sum_parade <- parade_summary(my_parade)
#> Warning: The outcome variable (mpg) contains 25 unique values. Perhaps you can draw standard diagnostic plots instead of averaging the residuals?
#> Warning: Not all grouping variables are characters or factors. Are you sure you want to use this function?
# Draw plot
var_plot(my_sum_parade)
 reveal(my_sum_parade)
#> The true data are in position 14.
# or
reveal(my_parade)
#> The true data are in position 14.
reveal(my_sum_parade)
#> The true data are in position 14.
# or
reveal(my_parade)
#> The true data are in position 14.